


Hypothesis Test for a Population I give you example make same answer but different words
Question Description
Context
A group of 75 college students from a liberal arts college wererandomly sampled and asked about the number of alcoholic drinks theyhave in a typical week. The file containing the data is linked below.The purpose of this study (Links to an external site.) wasto compare the drinking habits of the students at the college to thedrinking habits of college students in general. In particular, the deanof students, who initiated this study, would like to check whether themean number of alcoholic drinks that students at his college have in atypical week differs from the mean of U.S. college students in general,which is estimated to be 4.73.
Variables
The number of alcoholic beverages a student consumes in a week.
Data: Hypothesis test results:
| Variable | Sample Mean | Std. Err. | DF | T-Stat | P-value |
|---|---|---|---|---|---|
| number of drinks per week | 3.9333333 | 0.43592434 | 74 | -1.8275343 | 0.0717 |
Prompt
The drinks datafile is available in the Data section below.
- Let
be the mean number of alcoholic beverages that studentsin the liberal arts college drink in a typical week. State thehypotheses.
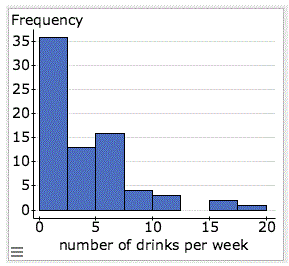
- Here is a histogram of the data. Can we safely use the t-test with this data? Explain.
- Perform the t-test using StatCrunch. (directions)
Copy and paste the information from the StatCrunch output window into your initial post. - Based on the P-value, state your conclusions in context. Use a 5% level of significance.
NOTE: You do not need to double the P-value for this two-tailed test. StatCrunch calculates the P-value for you. - Using the context of this scenario, explain the meaning of each offollowing items from the StatCrunch output for the hypothesis test.
- Std. Err (standard error)
- T-stat (T-score)
- P-value
- EXAMPLE TO ANSWER
1. The hypotheses are:
Ho: = 4.73
Ha: ≠ 4.73
2. Although the histogram is skewed to the right, we can still do a t-test because n=75 which is more than 30.
3.
One sample T hypothesis test:
μ : Mean of variable
H0 : μ = 4.73
HA : μ ≠ 4.73
Hypothesis test results:
| Variable | Sample Mean | Std. Err. | DF | T-Stat | P-value |
|---|---|---|---|---|---|
| number of drinks per week | 3.9333333 | 0.43592434 | 74 | -1.8275343 | 0.0717 |
4. 2(0.0717)= 1.434
1.434>0.05
We do not have enough evidence to reject the null hypothesis that theaverage amount of alcoholic beverages that students at this collegedrink is the same as the national average.
5. a) Std. Err. is the standard error, which is an estimate of how far from the actual mean a sample mean is likely to be.
b) T-stat is T-score, which is used in a t-test to find evidence/lackof evidence of a significant difference between population means.
c) The P-value measures the likelihood of getting results as extremeas the sample in a population where the null hypothesis is true.
Have a similar assignment? "Place an order for your assignment and have exceptional work written by our team of experts, guaranteeing you A results."
